Summary
On Monday, October 4, 2021, Facebook suffered a prolonged outage when, during routine maintenance, all connections to their global backbone network were mistakenly taken down. More details on the cause and response to the outage are available on the Facebook blog.
At Netskope, we help secure the cloud and web traffic of millions of users worldwide. In this blog post, we provide a glimpse into what the Facebook outage looked like from our perspective. Information presented in this blog post is based on anonymized usage data collected by the Netskope Security Cloud platform relating to a subset of Netskope customers with prior authorization.
The Facebook Outage
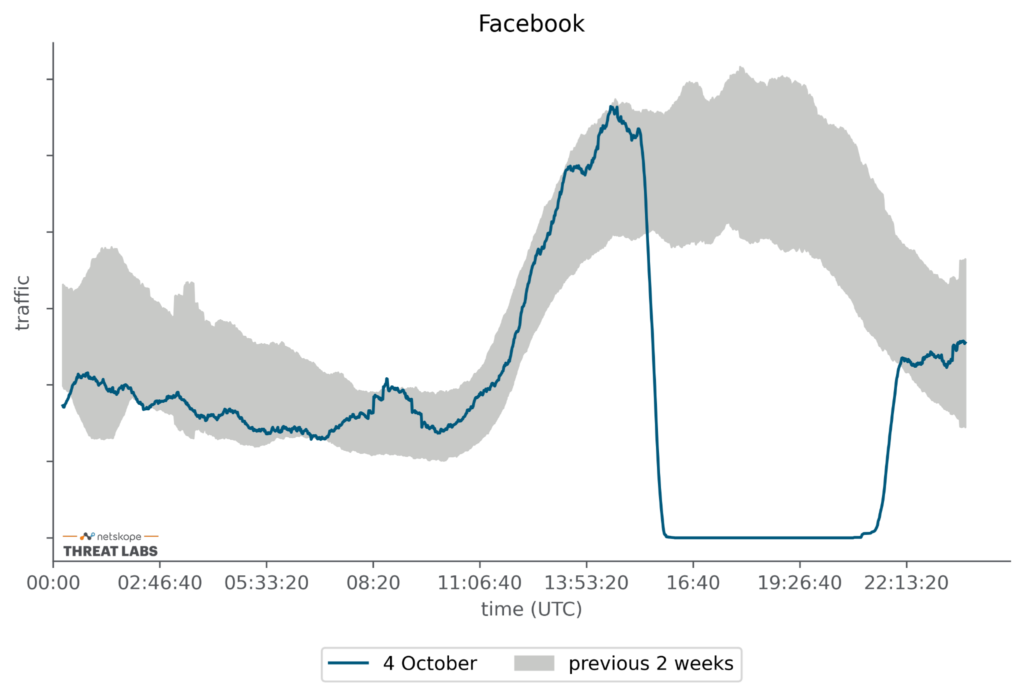
What did Monday look like compared to a normal day? The figure below shows the average and standard deviation of the traffic to Facebook in gray. The blue line shows the traffic on October 4. At 15:39 UTC the outage begins, and we see a sharp decline in Facebook traffic that lasts for 5.5 hours.
Where did everyone go?
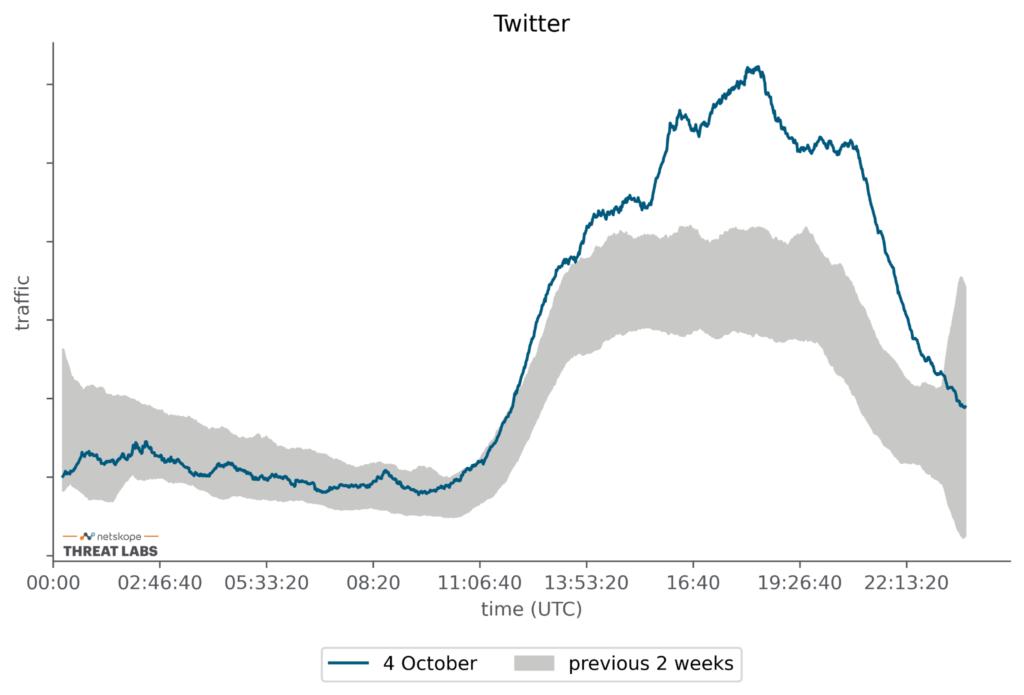
Without Facebook, what did everyone do? They spent the afternoon on Twitter instead. Traffic to Twitter saw a sharp increase in traffic at 15:39 that continued for the duration of the outage before returning to normal levels when Facebook came back online.
Any lasting effects?
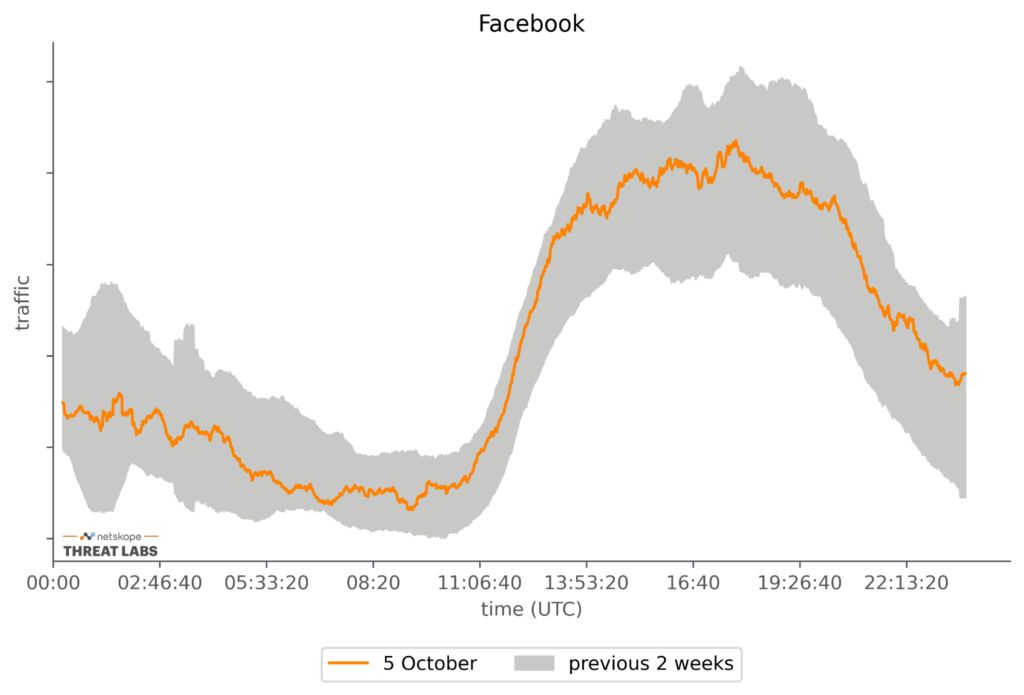
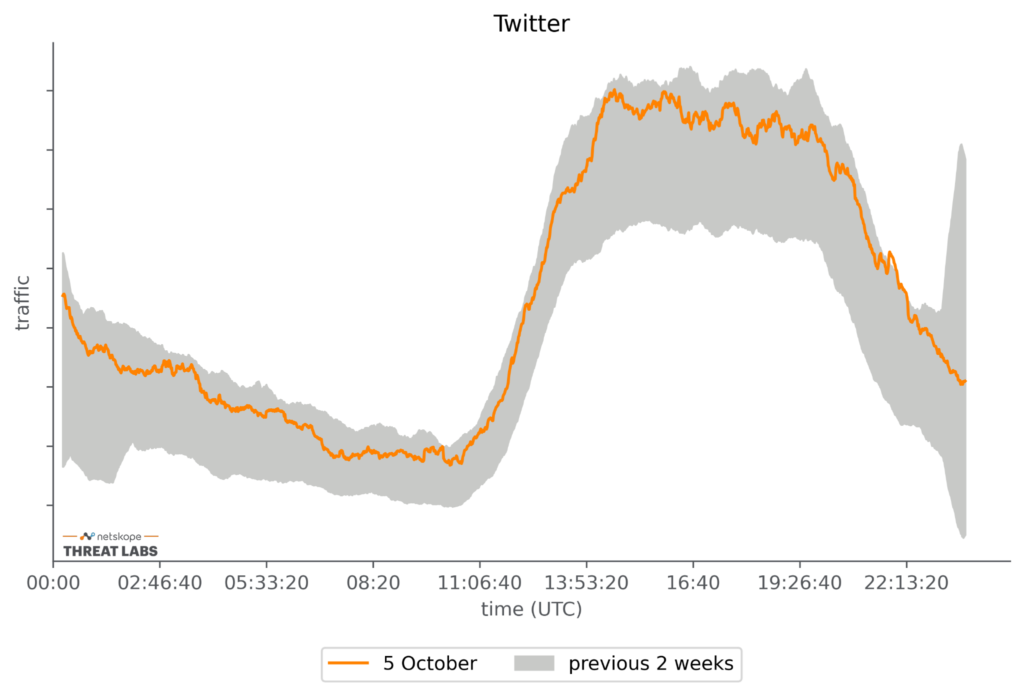
Did we see any carry-over effects into Tuesday when Facebook was back online? No. Facebook usage was back up to its normal levels, and Twitter usage was back down to its normal levels. For everyone who might have explored a new alternative to Facebook, Instagram, or WhatsApp, they all migrated back to Facebook services as soon as they were back online. Perhaps over time, those users may migrate to one of those new platforms they tried on Monday, but the outage didn’t prompt any mass exodus.


 Voltar






 Leia o Blog